

Help center
See your numbers: the analytics dashboard
2 min · updated Jul 24, 2026
In short
The analytics dashboard shows how your phone is really performing — calls per day, how many turn into captured bookings or messages, the mix of outcomes, and when calls come in — over the last 30 days.
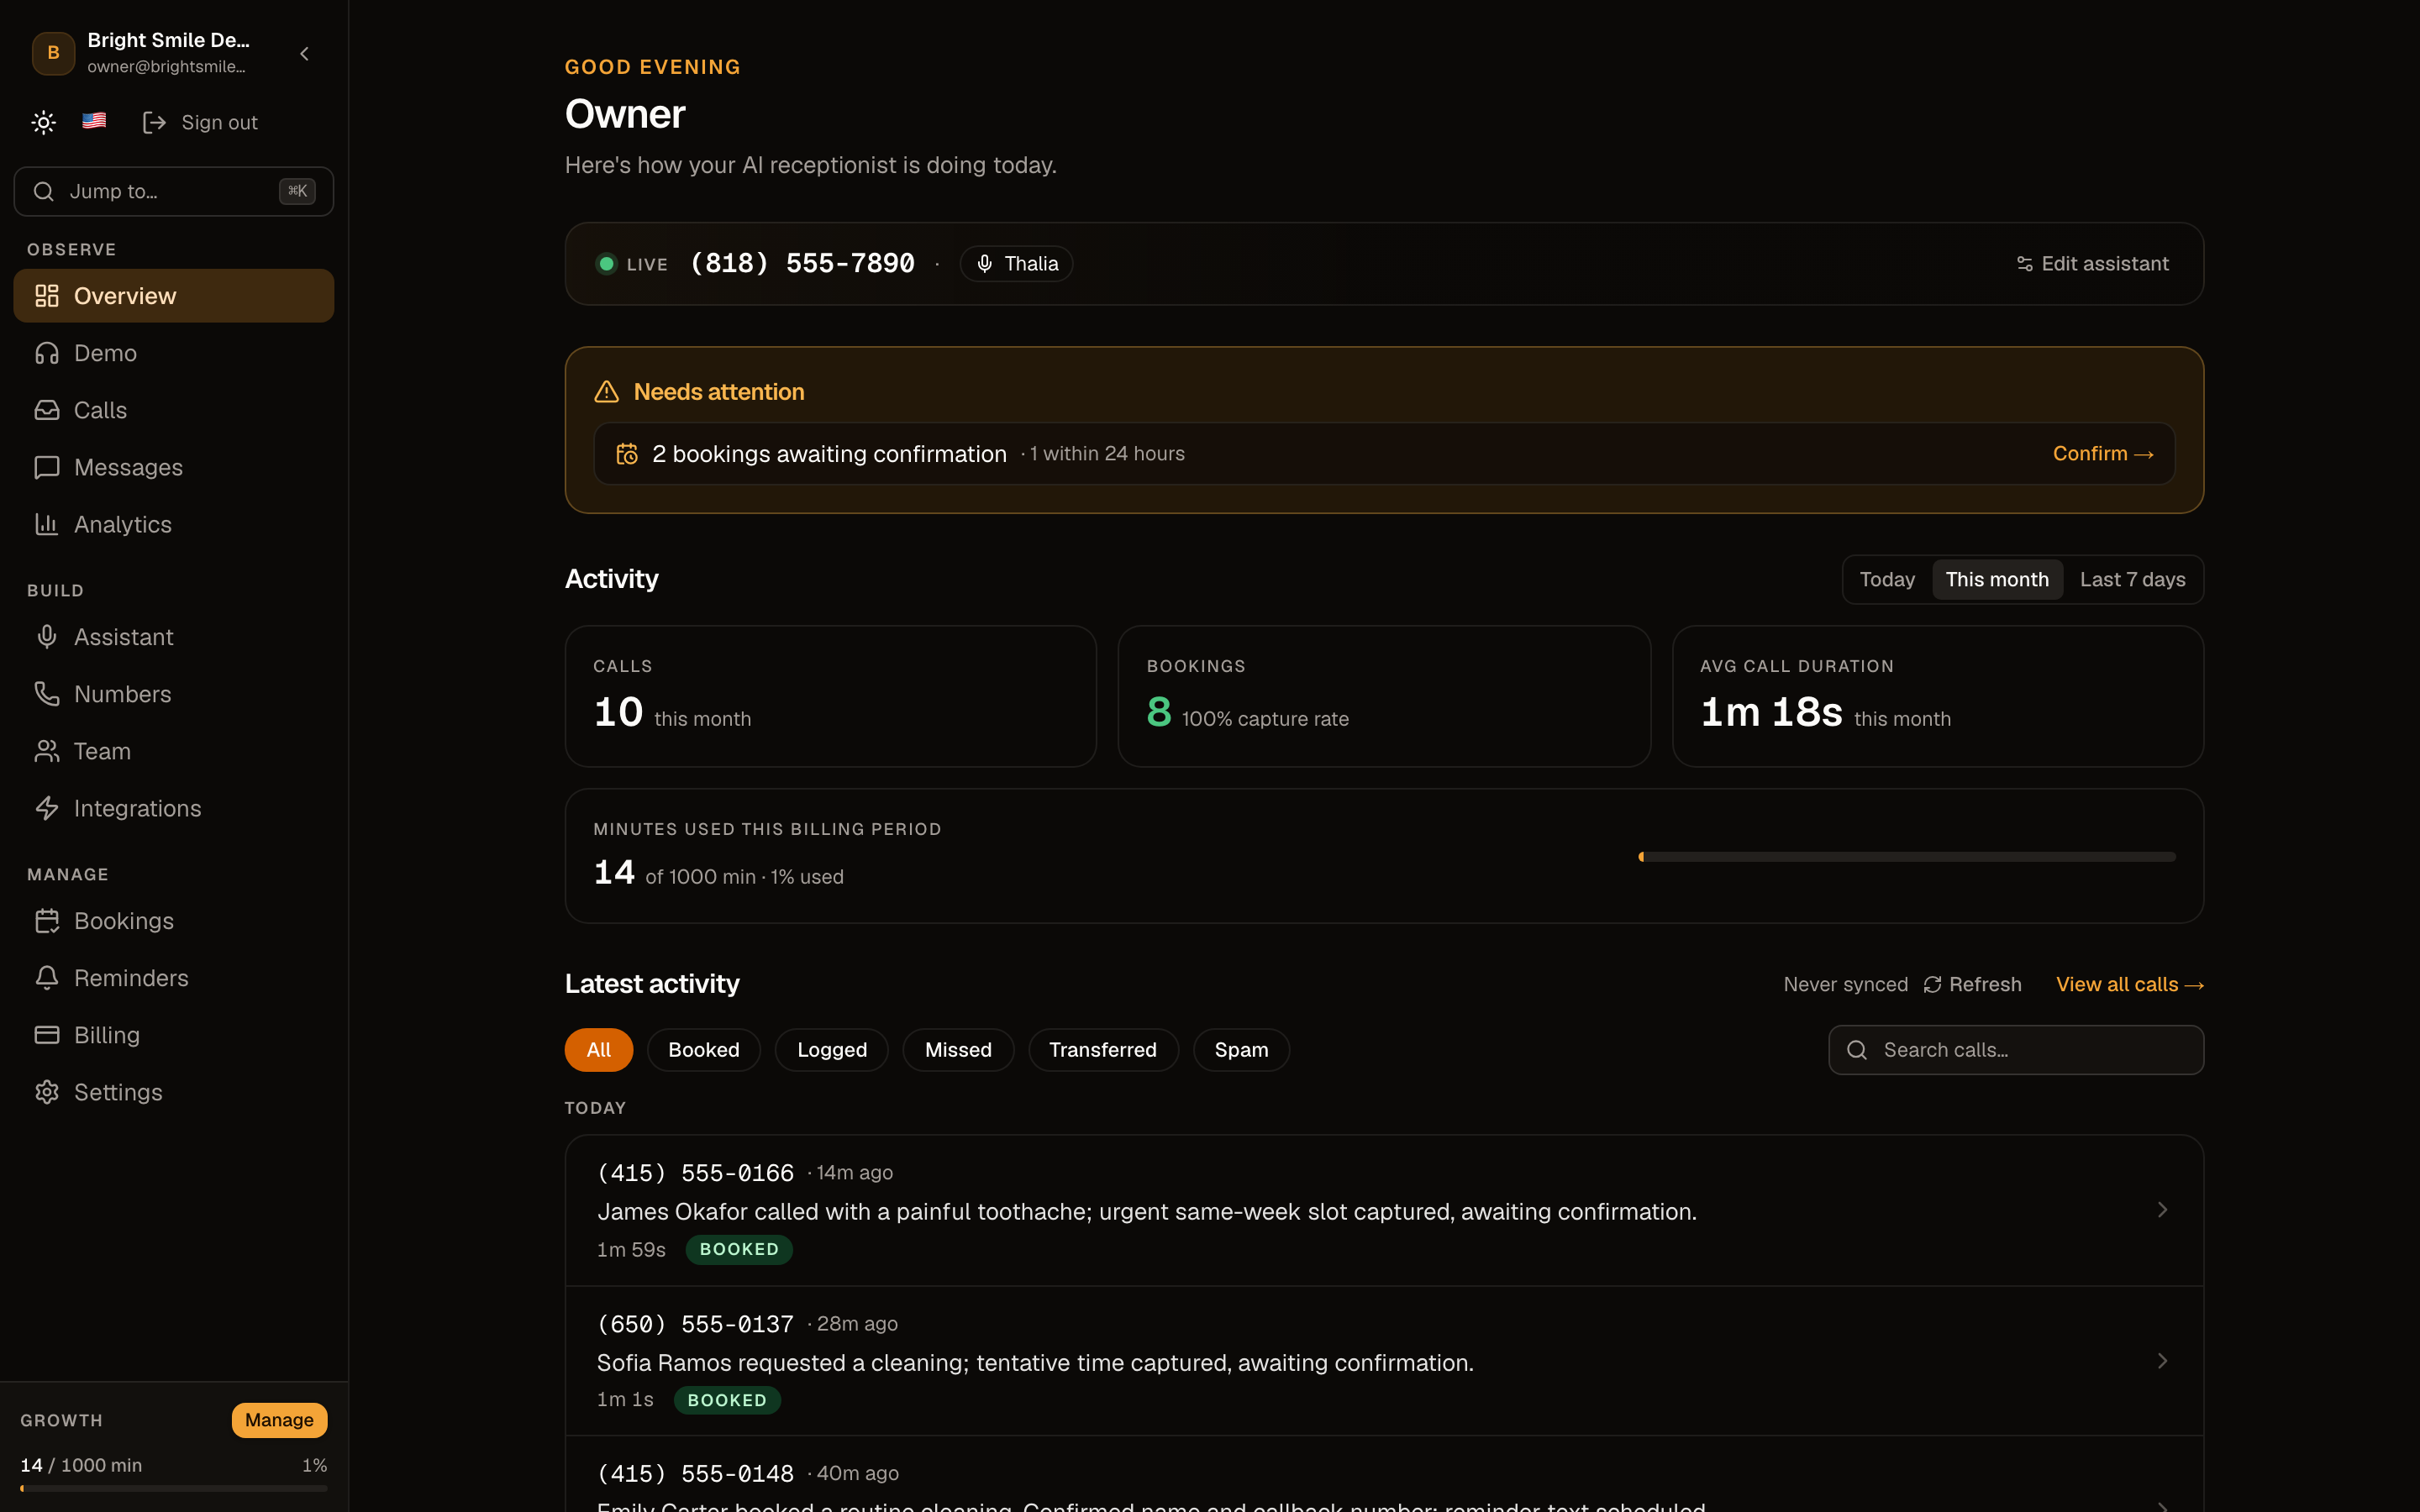
01Open Analytics
Go to Analytics in your dashboard. Everything is for the last 30 days and shown in your business timezone.
Analytics is a Growth-plan feature.
02Read the charts
Calls per day shows volume and trend; Capture rate shows how many calls turned into a booking or captured message; Outcome distribution breaks calls down by result; and “When calls happen” is a day-of-week × hour heatmap that shows your busy windows.
03Act on what you see
Use the heatmap to spot after-hours demand (a reason to run Full AI overnight), and the capture rate to judge whether your FAQs and services are complete enough for the AI to close more calls.
Frequently asked questions
Why does it say “not enough data yet”?
The charts need a handful of real calls before they're meaningful. Once calls come in over a few days, the dashboard fills in automatically.
See also
Related guides
Ready to try it? Get a working AI receptionist in about five minutes.
Start free